Friday, April 30, 2010

How will we determine the magnitude of the next correction?

The calculated trendlines for the small pattern in the upper right (labeled with small blue numbers) will be followed if the correction is relatively short and shallow. Should the correction turn severe, after a little while of following the trendlines generated from the small blue numbers, we will see the price action jump towards deeper trendlines generated from some of the longer term segments, here numbered in red....that's how we will know what's going on at a deeper level...

(Click to enlarge)

Catherine Austin Fitts - Goldman Whack-a-Mole

http://solari.com/blog/?p=7076

Some strange things happening before our eyes...

Thursday, April 29, 2010

Waiting for intermediate level decline...

The divergence we're seeing on indicators suggests a medium level decline is likely. Whether it becomes more than that, will only be determined after it runs a while....

Warning for Britain as financial chaos spreads to Spain

http://www.telegraph.co.uk/finance/financetopics/financialcrisis/7649392/Warning-for-Britain-as-financial-chaos-spreads-to-Spain.html

Excerpt:

Yesterday David Cameron, the Conservative leader, suggested Britain could follow Greece into crisis. “Greece stands as a warning to what happens if you don’t pay back your debt,” he said.

David Miliband, the Foreign Secretary, accused Mr Cameron of “economic illiteracy”. Lord Mandelson, the Business Secretary, insisted that Britain was in a “very, very, very different situation” from Greece, because the UK retained its AAA rating.

But Neil Mackinnon, an economist from VTB Capital, said it was “a mystery” that Britain had not yet been downgraded.

Angel Gurria, the head of the Organisation for Economic Co-operation and Development, said “contagion has already happened”, likening the crisis to the flesh-eating bug Ebola.

Wednesday, April 28, 2010

There's a lot of activity on the legal front against Goldman and the New York Fed, but..

Sounds like some tough prosecutors, Neil Barofsky and Robert Khuzami, are going after the NewYork Fed and Goldman, respectively. I haven't posted anything about these stories yet, because it remains to be seen how aggressive these campaigns turn out to be. As good as these men are, I don't think the American legal system is up to the task, I don't believe the U.S. can reform itself. I would like to be proven wrong, but I think the U.S. is too far gone to be revived as an ongoing concern - corruption is still spiraling upward as far as I can see, and some kind of collapse is probably baked in the cake already....

The New Secessionists


http://www.informationclearinghouse.info/article25314.htm


Yes I agree, the system probably can't be fixed...

Tuesday, April 27, 2010

Big Down day...

Looks like the correction may have started, although I would say we would need a couple more days like this to be sure, and I have price targets that should confirm this when they are reached....

Monday, April 26, 2010

The Imminent Crash Of The Oil Supply


http://www.marketoracle.co.uk/Article18948.html

Excerpt:

The world was completely transformed by oil for the duration of the twentieth century, but if the graph is right, within 20 years it will be virtually gone but our dependence upon it will not. Instead, we have:

  • zero time to plan how to replace cars in our lives
  • zero time to plan how to manufacture and install millions of furnaces to replace home oil furnaces, and zero time toproduce the infrastructure necessary to carry out that task
  • zero time to retool suburbia so it can function without gasoline
  • zero time to plan for replacement of the largest military establishment in history, almost completely dependent upon oil
  • zero time to plan to support nine billion peolple without the "green revolution," a creation of the age of oil
  • zero time to plan to replace oil as an essential fuel in electricity production
  • zero time to plan for preserving millions of miles of roads without asphalt.
  • zero time to plan for the replacement of oil in its essential role in EVERY industry.
  • zero time to plan for replacement of oil in its exclusive role of transporting people, agricultural produce, manufactured goods. In a world without oil that appears only twenty years away, there will be no oil-burning ships transporting US grain to other countries, there will be no oil-burning airlines linking the world's major cities, there will be no oil-burning ships transporting Chinese manufactured goods to the billions now dependent on them.
  • zero time to plan for the survival of the billions of new people expected by 2050 in the aftermath of ":peak everything."
  • zero capital, because of failing banks ansd public and private debt, to address these issues.

Friday, April 23, 2010

Barcharts Output - $SPX

Here I am playing with the $SPX monthly charts, and noting the bottom indicator StochRSI. Both of the major tops were preceded by divergences in this indicator which I have marked with brown arrows at the bottom of the chart. The points in time where this indicator was maxed out against the top value and pulled away I have marked with thick Black lines, see what happened afterwards...The chart at this point looks Bullish actually, no divergences present...I welcome your comments...

What seems reasonable to me is that we might see a correction, sufficient to relieve the overbought pressure (which could happen anytime), and then a resumption of the upside...I've been generally skeptical of this rally for a while, but there doesn't seem to be any internal weaknesses or divergence, just some overbought conditions such as is seen in young bull markets...

Another look at Monthly Bollinger Bands: QQQQ and IWM

Note that Barcharts might calculate their charts slightly differently then Bigcharts, but theirs are also updated pretty fast, Bigcharts waits until after midnight to update their weekly and monthly charts...

Anyway here are the monthly Bollinger Bands for QQQQ and ILM (proxy for the Russell 2000):

Rather looks like the Russell is already in it's bands and the Nasdaq 100 is close...So if we're in a mania, it may push these wider, if it's supposed to stop it should be real soon...

Something is changing...

I am thinking as of this afternoon that most trendlines are being exceeded, some by quite a bit...I think this is still a FED powered rally, and all normal limits are being pushed through.. Today had rather high volume, reversing the trend of late towards low volume...so the Bear is maybe dying here unless something changes early next week..Note above, the big spike in volume and the associated CMF indicator (green)..

Note in the Bigcharts chart above, only the monthly Bollinger Bands stands in front of the $RUT's march upward...that might stop it in conjunction with the trendlines I posted earlier, but the volume stats right now don't look encouraging for the Bears...

Lastly in the charts below, I have shown how the recent spike in the $NDX looks, based on the regression of past highs. Are we seeing a parabolic blowoff that's near it's end, or just the superseding of existing exponential trendlines by a mania that has no defined boundaries? Right now truthfully, I'm not sure..

Russell 2000 Microtrendlines


Note the important trendlines for the moment are in magenta....We are at a place you might expect a top...provided it stops rising much past the trendline, of course..

Tuesday, April 20, 2010

Letter from Iceland....

http://www.howestreet.com/articles/index.php?article_id=13138

Very Good!

It still doesn't look real safe to short this thing...


At least, not yet...See what the next couple of days brings...Need to see a pullback begin in earnest..

Top being retested..

It looks like the recent top is being retested about now...I note that Charles Nenner is still somewhat bullish in his models..I can't address that directly, although I do respect that he's an analyst held in high esteem...He seems to feel a short term correction is in the works...we'll see...The wave pattern he's suggesting seems rather unnatural in certain respects, but I try to keep an open mind...

Sunday, April 18, 2010

Friday, April 16, 2010

Nice downleg seems to be starting here...

It's got some good volume, too...

Another sign of 'The Top' - Goldman Sachs sued by SEC for Fraud!

http://www.nakedcapitalism.com/2010/04/sec-sues-goldman-for-fraud.html

Let's see if anyone goes to jail, though...So far, the Banksters have been immune...This is a civil, not criminal case...There needs to be criminal charges, because that's what they are...

Thursday, April 15, 2010

The moment of truth...

The upper black, down-sloping channel line (now calculated to be at 1210.46) has now been reached and slightly exceeded, at a high of 1213.92. If this upper trendline channel works, this rally should be over...I suppose it could go sideways for a few days, tops are notorious for doing that, but the overall position should be that the bull run from the March 2009 lows is over...

Again, as always, we wait for the market to give us confirmation...

Wednesday, April 14, 2010

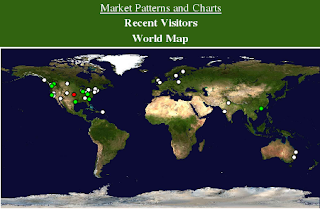
Recent Visitors by Location...

Wow!


I don't think I've ever seen both of these sentiment measures so extreme at the same time...Most indexes have also exceeded their daily Bollinger Bands by a good bit, as well. Tomorrow might see a slightly higher high and then a reversal...that's my guess...

This chart is from Sentimentrader.com...

I think we are in the final punch of this rally...sit tight...

I can't say the top is today...but you can compare (on the $NDX) this moment on the graph below with all of the previous ones..it looks like an overthrow...Compare with the previous post (yesterday) and the penetration below the zero line is getting fairly extreme...I wouldn't think you have many days of that ahead, and possibly, it actually finishes up today...we'll see...

Tuesday, April 13, 2010

Again, how close is the top? Close.


Whenever the blue line passes above the red line in the top chart, the 'local' top should be in, and I believe that will turn into something bigger than that, after it gets going...Note the '?' I have put on the chart. Close though it is, it hasn't happened yet. Wait....

(Click to enlarge)

April 2010 - US military warns oil output may dip causing massive shortages by 2015

http://peakenergy.blogspot.com/2010/04/us-military-warns-oil-output-may-dip.html

Here comes Peak Oil.....

Market Recap: When VXN Opened and Closed Below BB Bottom

http://www.safehaven.com/article/16405/market-recap-when-vxn-opened-and-closed-below-bb-bottom

This seems to corroborate the previous post...We are at or near the top...Still, wait for confirmation before doing anything...

Sunday, April 11, 2010

A possible $SPX Exponential channel...

This is a test, this is only a test....The exponential theory I have been developing doesn't exclude channels, but also doesn't explicitly create them....Look at the chart at the top of this post, here I found an exponential trendline (green) that defined the March 2009 bottom. By adding a set amount to it, I created the parallel black trendline that defines the tops here. Visually, it seems to look right, but we have to wait and see if the market turns around as it tickles the bottom of that black trendline. If it works, then we have identified a channel that maybe can help us find very important bottoms and tops well into the future, as channels do tend to persist in time...On ordinary $SPX charts that others use, these features will not be apparent or visible at all...Note how the conventional channel in the bottom conventional chart, (courtesy of Bigcharts) compares....Both charts cover the exact same time periods....

(Click on the charts above to enlarge them)

Saturday, April 10, 2010

Thursday, April 8, 2010

Islamic Banking: Is It Really Kosher?

http://www.american.com/archive/2007/march-april-magazine-contents/islamic-banking-is-it-really-kosher/

I am doing a rough overview of how banking rules differ from one civilization to another. I am curious to see if the corrupting influence of western banking is universal...

Check out also this Wikipedia link:

http://en.wikipedia.org/wiki/Islamic_banking

interesting...Would these Islamic practices prevent collusion between big Islamic institutions to commit fraud on the scale of American or Western Banks? I am reading this new myself, and if you all have comments or insights please post them. I am not championing Muslim anything per se, but it's worthwhile to see if other cultures really have usable ideas...

Getting interesting out there...


I will wait for both of these price patterns to go below all trendlines in both charts before adding short positions (it's a safety thing, and my recommendation), but I suspect the turn is happening now...

Saturday, April 3, 2010

Max and Stacy again...they're amazing...

http://ia361309.us.archive.org/12/items/MaxKeiserRadio-TheTruthAboutMarkets-03April2010/tam030410.mp3

Why it is that in the near future, movies will be announced but never produced, but studios and traders will make hundreds of millions on them anyway....and why in the future celebrities will be prevented by the SEC to speak out on political issues...and why Iron Ore will join the commodities whose price isn't reflected by supply and demand, it will only reflect trading activities in derivatives focused on the Iron market...and more, and more...

Jump in interest rates close...


Bill Stockwell has come up with this chart showing a 'ripe' ascending wedge in interest rates on the ten year note. His interpretation is a jump in inflation, which could be, although it could just as well be deflation...all we know is interest rates are ready to jump, as these formations 'pop' rather fast...

Friday, April 2, 2010

Diminishing Marginal Productivity of Debt


http://economicedge.blogspot.com/2010/03/most-important-chart-of-century.html

America Now enforces Capital Controls

Found by Young Grasshopper...

Three days ago over at zerohedge.com, they ran a story titled “It’s Official – America Now Enforces Capital Controls.” Here’s the story’s lead-in:

" It couldn't have happened to a nicer country. On March 18, with very little pomp and circumstance, President Obama passed the most recent stimulus act, the $17.5 billion Hiring Incentives to Restore Employment Act (H.R. 2487), brilliantly goalseeked by the administration's millionaire cronies to abbreviate as HIRE. As it was merely the latest in an endless stream of acts destined to expand the government payroll to infinity, nobody cared about it, or actually read it. Because if anyone had read it, the act would have been known as the Capital Controls Act, as one of the lesser, but infinitely more important provisions on page 27, known as Offset Provisions - Subtitle A – Foreign Account Tax Compliance, institutes just that. In brief, the Provision requires that foreign banks not only withhold 30% of all outgoing capital flows (likely remitting the collection promptly back to the U.S. Treasury), but also disclose the full details of non-exempt account-holders to the U.S. and the IRS. And should this provision be deemed illegal by a given foreign nation's domestic laws (think Switzerland), well the foreign financial institution is required to close the account. It's the law. If you thought you could move your capital to the non-sequestration safety of non-U.S. financial institutions, sorry you lose – the law now says so. Capital Controls are now here and are now fully enforced by the law. "

After reading through the “Hiring Incentives to Restore Employment Act,” which is actually H.R. 2847, not H.R. 2487 as indicated above, the assessment by zerohedge.com appears to be accurate. Sure there are those who will say that this bill is about “cutting down on tax evasion” not “capital controls,” but I think that’s naïve. Even so, I encourage you to read the entire piece by zerohedge.com (link here) and all 48 pages of the HIRE Act (link here) so you can decide for yourself

Thursday, April 1, 2010

A little on the dollar...

One of my blog readers was asking about the dollar. I have tended to avoid dealing with it lately because it's not merely a technical issue, but political as well, and charts don't always reveal political moves before they happen...

That said, in spite of the fact that it has recently been stopped in it's advance by one of the major rising trendlines, I think it's tracing out a big A-B-C pattern...Most moves don't stop until they hit one of the .500 nodes and we're quite a ways in time from one of those..So I put the C wave where it might end up...


I think we're in deflation, overall, until the sovereign debt crisis explodes, and we end up devaluing. The timing is tricky here, and if we enter the debt crisis earlier rather than later, it could change my overall bullish bias for the dollar, and keep commodities moving higher in spite of weak demand...

Trendlines again...


They seem to be hanging there, but there's always a bullish bias just before a holiday...