Tuesday, July 13, 2010

Where we ended up, for the day...


The $RUT has a bit to go to hit it's upper trendline, the bear case is still O.K. as long as the $RUT, finishing it's rise, doesn't drag the $SPX and others too far over their trendlines, thus creating a breakout and a new Bull run. That would be a time for Bears to quickly abort their positions...

Be careful here....

It's the VIX's turn for narrowing bands..


This 'seems' to be confirming a top not too far away. Time to be wary, there's always a chance we could be seeing something really unexpected develop here...

Afternoon meltup

It looks like the $RUT is sprinting along towards it's upper trendlines as well, probably won't finish today. Wild ride. This rally had more power than I thought, we'll see what happens tomorrow...

Hitting the upper trendlines again, at least on the $SPX...


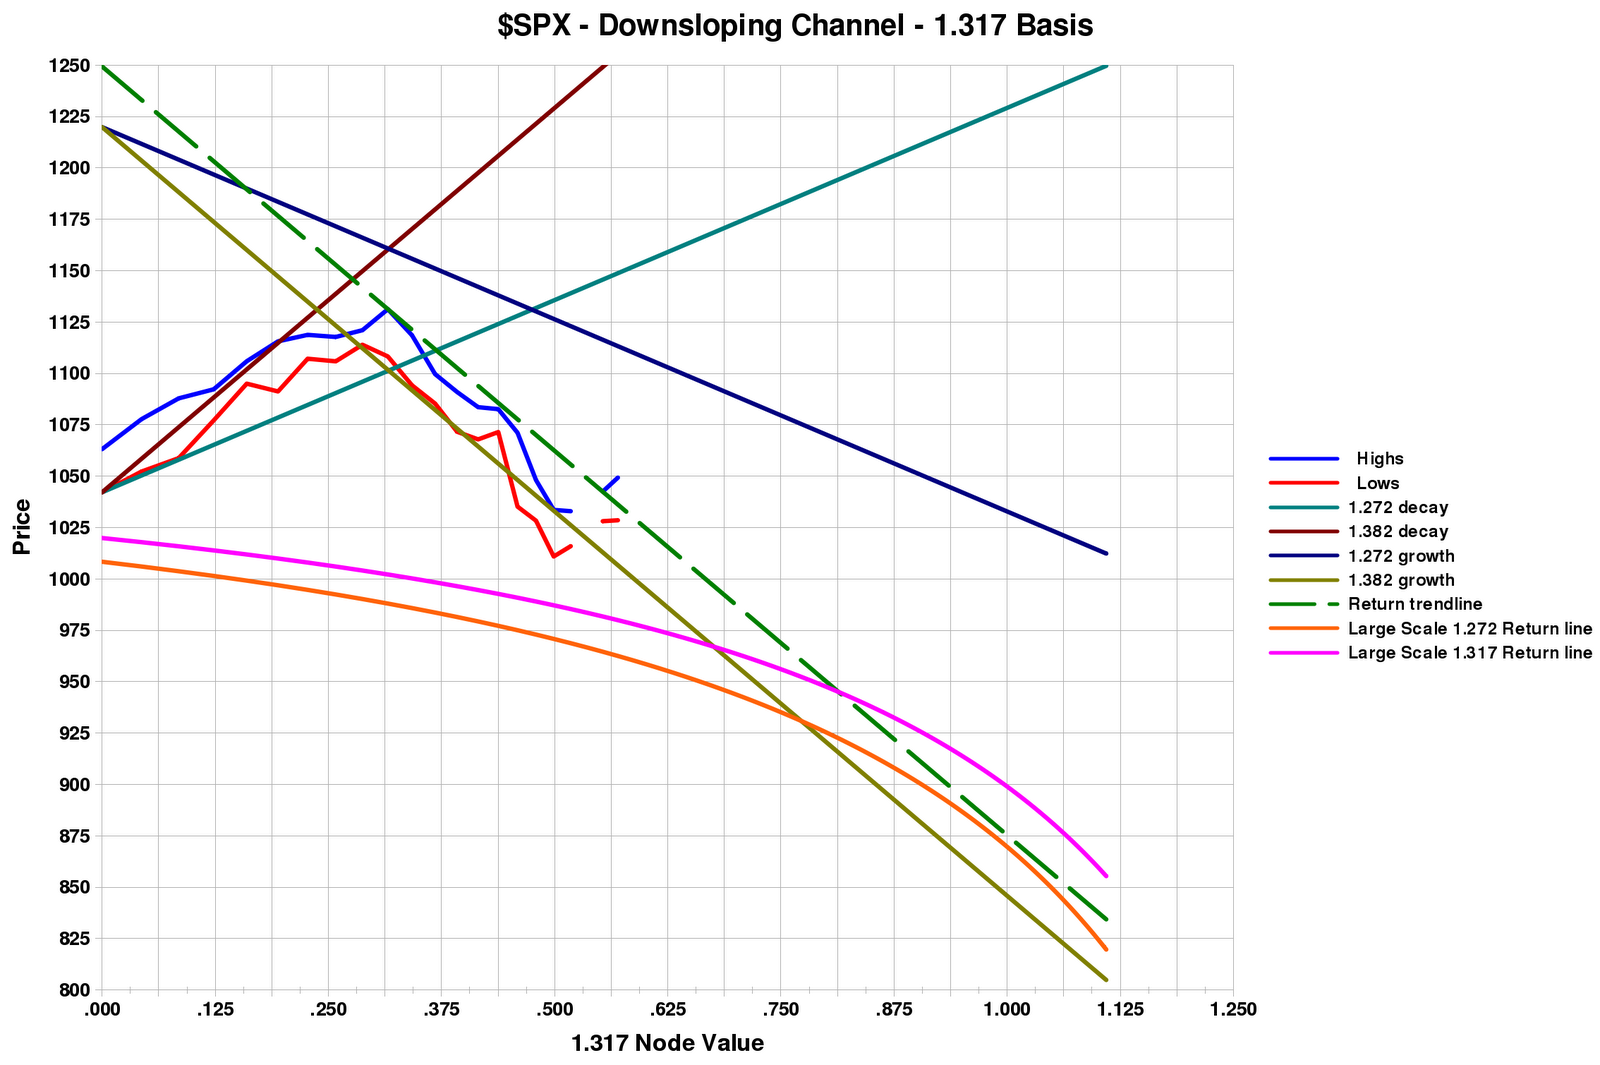
As happened on 6/21/10, the $SPX showed a marked narrowing of the 15 minute Bollinger Bands before it vaulted above the high exponential trendlines this morning...Having not looked for this phenomenon until recently, I don't know how common it is, but it looks like something to watch for in the future...

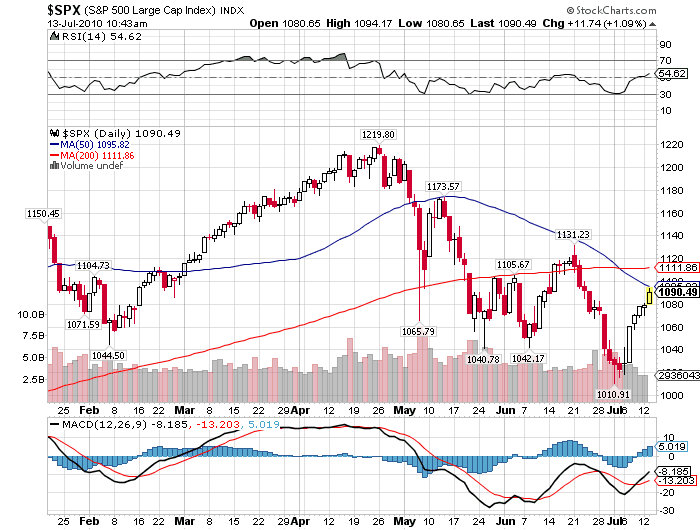
Notice that the $SPX has also caught up with the 50 day moving average, which has helped define a couple of previous tops:


Oddly, I haven't found the $RUT to be 'up against' anything in terms of exponential trendlines, but the 20 day moving average (which is the core of the Bollinger Bands), is acting the same as the 50 day moving average on the $SPX, offering resistance and support, here and there:


I will wait one more day before going short. I want to see a good down day to confirm the trend change that looks likely now...

The Herd Leaves the Market to the 'Bots - Yelnick


http://yelnick.typepad.com/yelnick/2010/07/the-herd-leaves-the-market-to-the-bots.html#tp


Small investors are mostly gone...

Sunday, July 11, 2010

An ambiguous moment.

As you all know, I've closed my long positions (which were in the Russell 2000) as I saw indicators and chart patterns that looked like the end of a trend. It still looks that way to me, but I also can't quite find the justification to go short yet. The $SPX is near the top of it's big down-trending channel, not at the top of it, but close enough to question the risk of staying in as a 'long' trade. The Russell 2000 is somewhat different. It looks 'only' about halfway up, and though it is stalling at a trendline, the main resistance is pretty high above it. I have also realized over the last couple of swings that these micro channels I have discovered, and profitably utilized, have a front and a back. On both indexes we may be seeing the breakdown at the front of the channel, but these are uncommonly wide channels, which means it could take quite a few days to cross them, even if the market remains more or less flat. With a slight rise, say, after a minor correction, it could take even longer to cross the channel, which would result in a reasonably higher market, even though the big rise had already expended itself. Thus my caution at going short.

Friday, July 9, 2010

Double bottom in the $VIX?


It needs to be confirmed on Monday, but I believe you can all see what I'm looking at....

Notice also, the inverted put-call ratio:


A similar hint.

Rally stalling?

I just sold my longs, didn't like the way the market is acting. On the intra-day charts, most markets look vaguely like an ending diagonal:


So, I made a modest profit.
But I'm not ready to re-short this thing just yet...Maybe soon though....

Update: more evidence of topping action...

Notice that RSI on this hourly $SPX chart is somewhere between 70 and 80 (very overbought), and the MACD histogram is going flat, meaning that there is no momentum left. That indicator combination is a usual precursor to declines. Not guaranteed, but likely...


Thursday, July 8, 2010

The Global Political Awakening and the New World Order

The Technological Revolution and the Future of Freedom, Part 1


http://www.globalresearch.ca/PrintArticle.php?articleId=19873

Gold and Silver - Will They Protect You?

by Mac Stavo

http://www.marketoracle.co.uk/Article20916.html

Very interesting charts of the Silver - Gold ratios going back to the early 1900's...

Crisis Redux Road To Perdition - Jim Willie

http://www.marketoracle.co.uk/Article20907.html


VERY Interesting excerpt:

A queer statistic has emerged that underscores the perversion that is Wall Street and the stock market. High Frequency Trading has not gone away. A couple months ago, when it was exposed during a single day swoon event, such trading was responsible for 83% of the entire New York Stock Exchange trade volume. Somehow the word 'CircleJerk' comes to mind as the Oligarch Banks compete toward a liquidity climax with fewer players of potency remaining each year. A liquidity analysis by Abel-Noser indicates that the US stock market has morphed into a sickly concentrated pool where the top 99 stocks account for 50.1% of total domestic trading volume. In June, the top 20 stocks accounted for 28.9% of all domestic volume, an increase to record level logged each month. The HFT algorithms are forced methodically in a reduced number of only the most liquid stocks. The game actually results in gradual removal of players from the market. The US stock market will eventually develop into a tomb without volume. At that time, large pension and mutual funds will be forced to consider that their vast portfolios might be worth something on par with the volume-less mortgage bonds tucked away in the acid cellars. Their large investment stakes in stocks simply will not be redeemable. The SPX stock index chart should conjure up images of Wiley Coyote legless over the canyon.

Wednesday, July 7, 2010

$SPX and $RUT microtrendlines

End of day charts.


Notice that both charts show a trendline immediately overhead. These will probably provide a pullback where more longs can be added late tomorrow or Friday. Eventual top will be at the high orange and/or magenta trendlines on both charts where the last top occurred, I would guess...

Oil Head-Fake Update: Why Alt Energy Will Never "Pencil Out"

http://www.oftwominds.com/blogjuly10/oil-headfake07-10.html


Advocates of a smooth transition away from petroleum may be surprised by the consequences of huge swings in the cost of oil.

The Craigslist Jobs Indicator - Mish Shedlock

http://globaleconomicanalysis.blogspot.com/2010/07/craigslist-jobs-indicator.html?utm_source=feedburner&utm_medium=feed&utm_campaign=Feed%3A+MishsGlobalEconomicTrendAnalysis+%28Mish%27s+Global+Economic+Trend+Analysis%29
The Friday Craigslist Los Angeles and Seattle job listings I track are down considerably over the past month.

From the lows of 2009, where they averaged 700-800 in LA and 500's in Seattle, they spiked to over 1000 in LA and to 800 in Seattle starting around January/February 2010 until as recently as this May.

Then job listings started a gradual decline into the 900's in LA and 700's in Seattle. Last Friday, the numbers were barely 800 in LA and 580 in Seattle.

These numbers are getting uncomfortably close to the numbers of 2009.

New up channel...

As we exit to the right from this old channel:


We begin a new one.


The orange and magenta lines are the targets overhead, as they formally were below...

And here, the $RUT makes a nice double bottom. It is also forming a new up channel:

Tuesday, July 6, 2010

Up against the wall..


The markets are trying to rally from very oversold conditions. This morning we saw quite a pop, but it's having more trouble now. Here's why:

We're still in the channel (barely) and the market hit it's head this morning at the high a little after 10:00 A.M. eastern time. The $RUT looks the same way as the $SPX....


Monday, July 5, 2010

Steve Keen’s Scary Minsky Model from Naked Capitalism

http://www.nakedcapitalism.com/2010/07/steve-keens-scary-minsky-model.html

Charts you shouldn't miss.....

My Tea Party by James Howard Kunstler


Excerpt:

One of the few things I agree on with the existing tea parties is that the Republicans and Democrats have made themselves hopeless hostages of political money and bargained away their legitimacy. In line with my general belief that American life must downscale or die, I'm not wholly persuaded that federalism can survive in any case - but assuming it will lumber on for a while anyway, the two major parties cannot retain their monopoly on power. Indeed, it is in the natural order of things that this country must periodically endure a realignment of political ideas and political power. This tends to occur during moments of cultural convulsion, and that is exactly the moment we are in as the sun sets on the fossil fuel based industrial extravaganza and we enter a crisis of intense resource austerity.
The other tea parties have been silent on the war because of the ties between Christian fundamentalism and military chauvinism. This is due, I suspect, to the tea parties first emanating out of Dixieland, where an old Scots-Irish "cracker" belligerence persists in a romantic view of violence - and where, coincidentally, there happen to be so many US military bases, and families dependent on careers connected with them. The confusions of hellfire Christian theology with governance form an overlayment on this, so you end up with a political culture favoring military adventures abroad and pushing citizens around at home on matters of social behavior (while mouthing a lot of disingenuous nonsense about "liberty").

Hope you all check this out, James Kunstler expresses my reservations with the Tea Party movement as well...

Sunday, July 4, 2010

Trader Heaven or Trader Hell?

It often happens that declines are expanding wedges or some such thing, and that sets up the next rally or Bull market. It's possible I see a nascent pattern here suggesting a scenario like that developing over the next several months to a year...

Now, the other possibility is that price action goes back and forth between the top, bold orange trendine on this chart and the 'derived' return trendlines shown recently on other posts (but not on this chart, and they are usually shown as dashed lines)...This would prevent the extreme swings I'm suggesting, as a possibility here...We'll just have to see whether the market chooses mild and constant volatility on the way down or increasing and ever more extreme volatility in it's descent. This latter mode was seen in the decline into the 2002-2003 lows....it has been seen before...

Also, the trendline envelope(s) I'm suggesting both preclude a 'crash'. I see nothing visually in these mild slopes (that get milder over time) that look like panic declines, but clearly wild swings between the trendlines are on the table....

Click to enlarge...