Wednesday, June 9, 2010

Keeping it simple....Green markers for Bull markets, red markers for Bear markets...


(Click to enlarge)

What I keep seeing...


Look at these odd wedges forming on these different indexes...I don't remember ever seeing such divergent patterns before across the different indexes....I'm not sure what to make of it....The bottom one, has of course, been 'transformed' a bit by my math programs, but it still looks basically the same as it's 'normal time' cousin, above it...

I went long this morning on leveraged $RUT ETF...

I'm having a good morning with this so far, expect a few days of upside before we hit the higher trendlines...

update:

It was an 'up' signal..I followed it up, it rolled over, I was stopped out for a small loss...

I've been whipsawed a bit the last couple of days...part of the game....

Tuesday, June 8, 2010

Overhead exponential trendline on the $SPX is at about 1100...

Now we'll see if it staggers up there and drops again...or goes through it for some reason...Today I got out with a small profit but it would have been bigger if I had pulled out about an hour sooner...I was really expecting the market to give me another 2% or so, oh well...Looking around I do see some divergences, but they weren't huge...except for some of the ones I check less often...like $NYMO....big positive divergence there..so we sit on the sidelines and wait...

Here are all of the trendlines relevant to the decline. The two thick orange trendlines represent both the trendline it's been following since the April top, and a higher one it could reach up to and follow (or bounce off of and come back down) if this market wanted to create a 'right shoulder' and decline from there...

Do we see an intermediate term bottom coming as we approach the weekly Bollinger Bands?


I think so...watch RSI on short time frames for fairly extreme readings as we get near the weekly BB's...Fibonacci considerations produce a possible bottom near the 1024 area...which is near the 1027.57 level of the weekly bands...

(click on the chart to enlarge it)

Update:

Fed engineered a bottom today at 1042.17, to create the illusion of a double bottom with 5/25/10. There seemed to me there was no technical reason for it, not yet oversold, not at Bollinger Bands...We'll see how well it sticks...

Monday, June 7, 2010

Market continues down....

The market's ($SPX) decline may pause briefly soon as the weekly Bollinger Bands are approached...but in general the decline seems strong at this point.

It's worth noting that the monthly Bollingers Bands are at about 740 and the quarterly Bollinger Bands are at 760...These levels should be watched as we approach them...a number of months into the future....

Of course, two things to remember about Bollinger Bands, (1) they move and (2) they usually are exceeded a bit before they work...

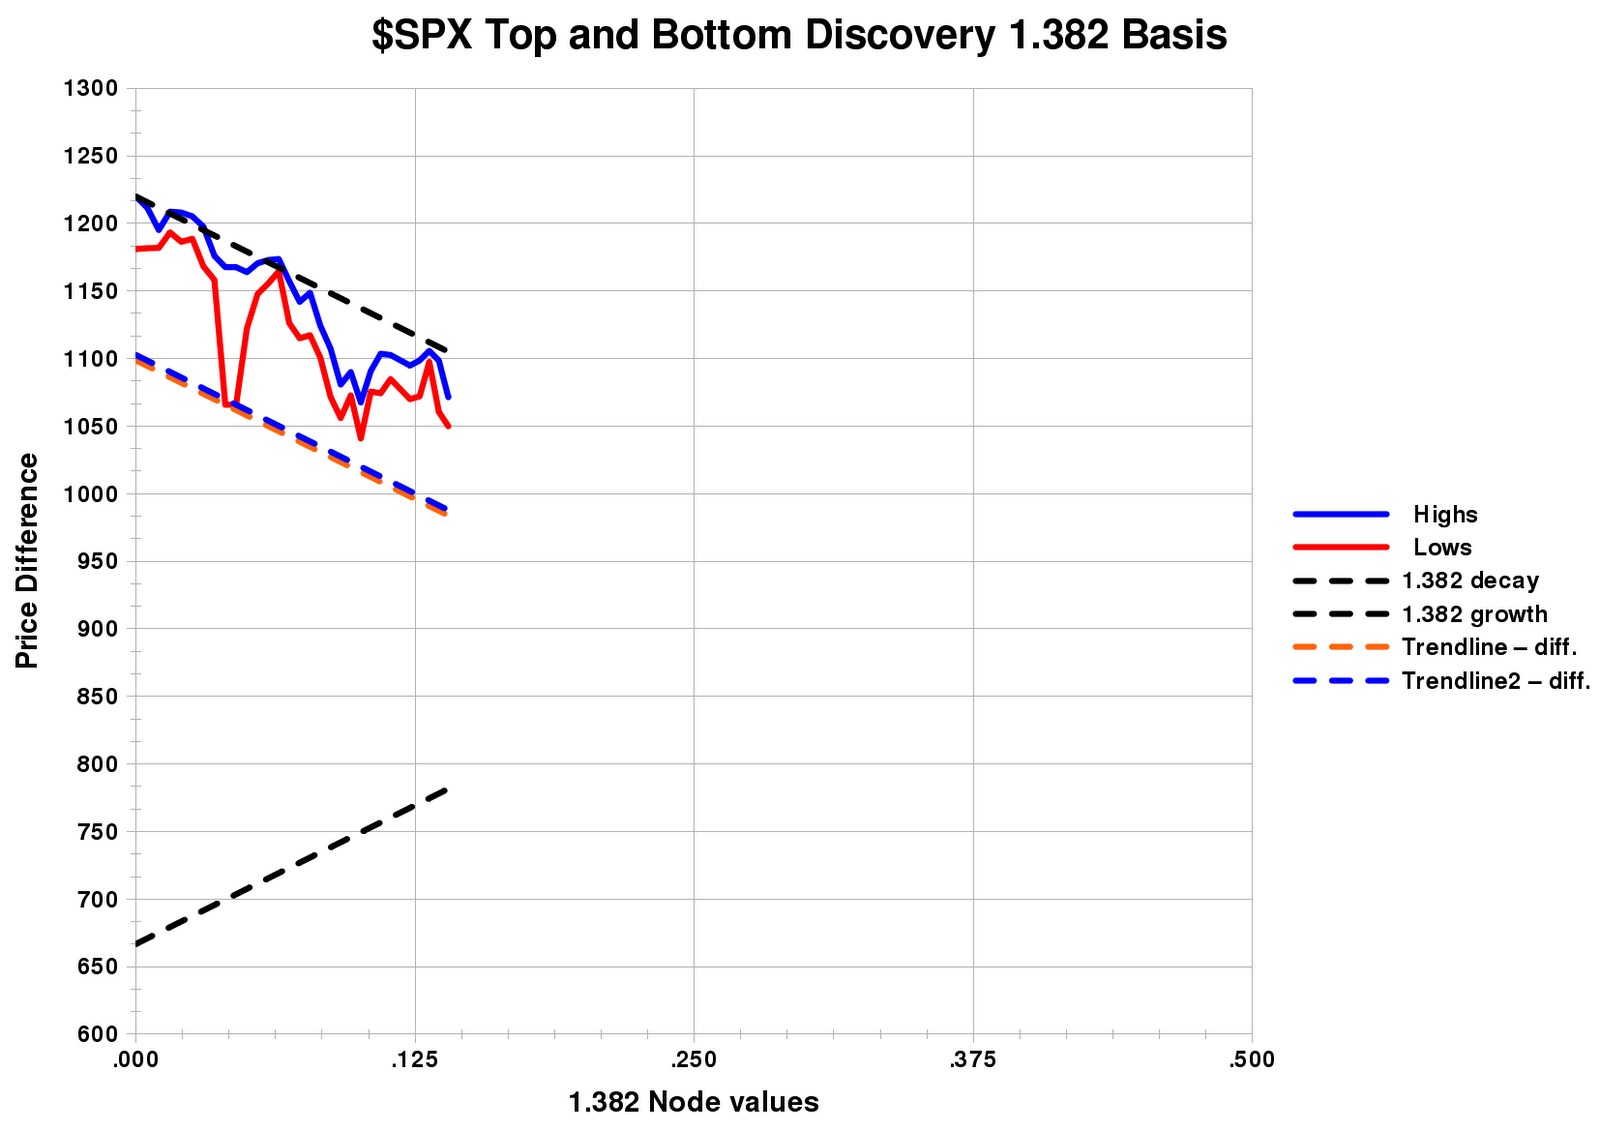
Today's chart:


Notice that the recent top of last Thursday (6/03/10) shows up on the chart as just a whisker past the .125 value on the X-axis (1/8 Node)....

Saturday, June 5, 2010

The slow death of the regulatory state


http://blogs.reuters.com/great-debate/2010/06/04/the-slow-death-of-the-regulatory-state/


At last the mainstream media is mentioning the obvious...That regulation everywhere is failing...From toxic financial products to toxic industrial products to toxic food items and clothing....Nobody is clamping down on this stuff...

Excerpt:

"Regulatory capture –where regulators come to share the interests and viewpoint of the industry they are supposed to be overseeing, rather than acting in the broader “public interest” — is nothing new. President Dwight Eisenhower warned about the power of the military-industrial complex in 1961.

But the scale of the capture across so many agencies, reaching into the heart of the regulatory state, under governments of all colors, is unprecedented in modern times.

It represents the largest “privatisation” of government since the Old Corruption of the 18th century (where government offices and laws were seen as an opportunity for private profit rather than a matter of “res publica” or the public interest)."


Spoken plainly, 'regulatory capture' is usually related to bribes and corruption....

The panic low of 5/25/2010...

Just for grins (and for my notes) I checked the values for RSI and the Ultimate Oscillator on the 15 minute charts for the $SPX and $NDX on 5/25/2010. The values for RSI were 15.86 and 13.95 for the $SPX and $NDX, respectively. For the Ultimate Oscillator, the equivalent readings were 24.15 and 24.95....

If you go to the 5 minute charts, you get for RSI, 10.862 and 8.904, and for Ultimate Oscillator 14.336 and 17.574, again for $SPX and $NDX in each case...

These are what major lows look like...although in this Bear Market, it will turn out only to have been a pause....

What would Hyperinflation look like?

There are many people concerned about excessive money printing (myself included). I found this site that describes what happened in Germany to the ordinary people in the early 20's, 'on the ground', as they went through such a crisis.

The experiences in the U.S. may well be turn out to be different, but this is instructive nonetheless...

Here's the link:

http://www.nowandfutures.com/us_weimar.html


After reading this, I can understand better what happened later in Germany...

Friday, June 4, 2010

Boycott BP!


http://www.citizen.org/boycott-bp


Sign the Petition, and pass it on!

Forgive us....

http://www.howestreet.com/articles/index.php?article_id=13629

These pictures say so much....

$SPX charts...


Both trendline charts are tracking the highs very well, and I suspect over time, one of the two charts will prove slightly more accurate, and I'll drop the less useful one...Right now in terms of the the Correlation Coefficient (Linear Regression stuff, for those that are familiar with it) shows that the top picture's trendline has a correlation of .993403 with the highs of this index, and the bottom chart's trendline has a correlation of .993726. Virtually identical accuracy exists for both charts. Right now, visually, I like the bottom one slightly more. Remember, perfect correlation is 1.00000. We're real close to that, about 7/10th of a percent off.

In case I forgot to say it, I went short late in the day yesterday, with a small position. Once we go below the 'flash crash' lows, I'll get more aggressive...

A Plague Upon The World: The USA is a "Failed State"

http://www.globalresearch.ca/index.php?context=va&aid=19458

Dr. Paul Craig Roberts was a former high official with the Reagan administration, and a deep and thoughtful guy.

His point here, is that the Bush-Obama administrations have shredded the Constitution. We are loosing/or have lost, Habeus Corpus, and other things. Since we are ethnically diverse as a nation, the Constitution was the only 'glue' there was. We are not a traditional country bound together by 'folk' traditions. Once it's generally recognized/understood that we no longer have the rule of law, our diversity will lead to anarchy, if I understand him correctly....

Market declining as predicted....

One of the stranger and more tragic things I see is how people coming in to this site are interacting with the charts I place here. The last post was headed by a conventional chart, showing a conventional trendline. The last two charts show the special trendlines I have created, which worked well this morning even as the conventional trendlines failed.

Guess which charts get clicked on to expand them for better visibility. The ordinary one at the top of the post, which produce no real information. The novel new ones, which performed well, got no clicks...

Makes me wonder about the fecklessness of people...

It also shows the power of the familiar, even if it's wrong....

Thursday, June 3, 2010

This morning's $SPX charts (so far)


Basically, these charts seem to be saying that we are now at another 'top'....This contradicts the daily MACD indicator and the put/call ratios, which looks so much like a warning of the beginning of a new up trend. The day is still young, but as of 10:50 CST, today's candlestick DOES look like a top,,,

The top chart shows a conventional trendline that will probably _not_ work...The bottom two charts show trendlines that _should_ work....

(Click on the individual charts to enlarge them)

Wednesday, June 2, 2010

Test of indicators coming...

If you look at daily charts, the MACD indicator looks to crossover in a positive fashion, it looks short term bullish. The next couple days will be critical in confirming the Bear. We have to see if MACD is warning us of some kind of pumping by the FED to overcome the Bear, or whether we are just seeing a small Bull trap forming, or whatever...Don't commit to too many positions either way until this resolves...

An introduction to Memristors

http://www.howestreet.com/articles/index.php?article_id=13590

Maybe able to model animal nervous systems....

This morning's Clickcharts...

Whenever the most recent bar turns red, I will go short...

http://www.clickcharts.com/Default.aspx?SID=SPX

Tuesday, June 1, 2010

CNN - Say goodbye to full-time jobs with benefits


http://money.cnn.com/2010/06/01/news/economy/contract_jobs/index.htm


And it's only a recession, right? Oh, I forgot, it's a recovery....

Rally from last Tuesday's bottom, struggling or dead?


UPDATE:

Maybe the little rally-ette is over. The $NDX today sported the kind of candlestick seen at tops ...

The other averages lost ground almost to the point below last Wednesday's close. If that happens tomorrow, then it's probably time to go short again...

Looking at the two regression plots above, I think the top one is now the closest fit, although I was previously favoring the bottom one. It takes a little while for the right regression line to announce itself sometimes...

For some reason the legend didn't show up on the snapshot of the top graph, but it's basically the same as the bottom one...

More States May Create Public Banks

http://www.yesmagazine.org/issues/water-solutions/more-states-may-create-public-banks

If every state did this, the Federal Reserve and it's cronies would have their legs cut out from under them. This would be a good thing....

Obama administration moves to distance itself from BP on oil spill response


http://www.washingtonpost.com/wp-dyn/content/article/2010/05/31/AR2010053103511.html


O.K., Obama is ready to take the gloves off against BP, as they have embarrassed him. Why can't he do the same with the bankers?

Friday, May 28, 2010

Checkout the Peakoil site

Matt Simmons, famous oilman-financier is saying on a video over at the Peak Oil site that BP maybe is plugging the wrong hole...and therefore will fail..

These guys (BP) are a good example of why the West is failing...corrupt, incompetent, and unable to see the big picture on anything. I think their mental disease runs rampant throughout the echelons of corporate and financial power here in the 21st century....

Thursday, May 27, 2010

GETTING CLOSER TO ANOTHER TOP - MAYBE?


We are already approaching the upper boundary of the channel, the rally could be over in a two or three more trading days...unless this Bear isn't real, which I doubt...

Remember, the chart above produces nice channels and straight lines only because it has been 'time-corrected' by my proprietary formula, that's why the x-axis doesn't have dates on it for labels, even though it does represent several weeks worth of time...

The anticipated little rally is showing some life, but the Bear is in control...

And on another note, here is an interesting article:

WHEN THE TOP CAVES IN

http://prorevnews.blogspot.com/2010/05/when-top-caves-in.html

High level anarchy is here...

The revolt starts...

14 states sue to stop Obamacare:

Alabama, Colorado, Florida,Idaho, Louisiana, Michigan, Nebraska, Pennsylvania, South Carolina, South Dakota, Texas, Utah, Washington, Virginia

14 states in process to pass clones of the Arizona immigration law:

Arizona, Texas, Colorado, Utah, Georgia, Pennsylvania, South Carolina, Oklahoma, Minnesota, Missouri, Maryland, North Dakota, Idaho, Nebraska

If you scan '14 states' you also find strange rumors of threats and counter threats between many of the states and the Federal Government...including charges of treason...

Lines are being drawn in the sand, we don't know all of the details, but a series of confrontations (at several levels) within the United States is in process...

I can't verify the truth of this next link, but what it says bears watching, and this news is being broadcast around in Russia as truth:

http://parkersburgwvteaparty.ning.com/forum/topics/obama-serves-14state-governors?xg_source=shorten_twitter

The world is becoming a very strange place...

Wednesday, May 26, 2010

The deeper problem, complexity of societies and the division of labor...and moral decay

It's clear to me that we live in a civilization that's failing many tests of safety, because you need regulation of all hazardous processes, and everywhere you look, the regulators have been 'captured'.

Of course, I mean bribed.

Big Pharma routinely puts out drugs that get recalled after killing or maiming a few people.
Big Farma (agribusiness) is busy inventing foods that kill us too. No oversight, the FDA is asleep on the watch for both of these industries...

Big Finance's abuses are all over the news, but we know about the SEC. It's been neutered.

The oil spill in the Gulf is also a case of regulators looking the other way, and no one was taking the risks seriously.

The military industrial complex (MIC) starts war after war, with no benefits to the American people at all, and the resulting pointless slaughter of other peoples is an abomination. Congress should be confronting this. They don't. The political contributions from the MIC are vast.

I could go on and on, but I realize now that this country had such powerful, moral, and intelligent ancestors, and they created such powerful, deep processes and systems, that only similarly powerful and quality people could maintain such a complex set of arrangements. But those people are now long gone. They were created in adversity, forged in the fire, and all we have in the present, is a bunch of egotistical third generation sycophants and losers, who unfortunately, have taken their place. Some of them are in fact, a bit creepy and thuggish.

In no way does the current boomer generation (mine) measure up to the people of the past...so it's back into the fire we go...

Losing the arms race with nature....

Most of you have heard that many formerly treatable diseases are now becoming resistant to penicillin and other antibiotics. Versions of TB and Syphilis comes to mind here, and there are others. In a like sense, our ability to fend off parasites to our food crops is also waning. Weeds are becoming resistant to herbicides, and this is forcing the big Agribusiness firms to genetically modify our core food crops to handle high levels of herbicides. These modified food crops are now suspected of being long term threats to the health of the consumers who routinely ingest them. GMO corn has shown a strong capacity to damage the livers and kidneys of lab animals after only 90 days consumption, but everyday, Americans eat vast amounts of it as corn chips, corn flakes and other products. Genetically modified Soybeans have been linked to drops in male fertility, and the list of GM crops is gradually increasing as corporate farmers use ever larger quantities of various poisons to maintain yields.

The point being, in the end, they will have to Genetically modify us in order to allow us to eat all of this crap without dying.

What of collateral damage? Most wars have some of that. How about the honeybees, whose numbers are in rapid decline, and though a fungus and some viruses have been implicated in the decline, there are questions as to why the honeybee populations are succumbing to pathogens that have always been around. Pesticides are being mentioned more and more often as the culprit behind the Bee's inability to fight off these fatal disorders..

So the future looks grim, for both disease control using antibiotics and for human nutrition, as we gradually poison the food chain with genetically freaky plants we can't ingest without damage, and then there's the poor bees, losing the race to survive and losing the ability to help produce much of our food through pollination.

Tuesday, May 25, 2010

Now sitting on the WEEKLY Bollinger Bands

If a bounce doesn't happen here I'll be surprised, we are now sitting on the Weekly Bollinger Bands, so we should finally see a rally to position for a Bearish entry point...

Monday, May 24, 2010

Natural Regression

Natural Regression is a short independant documentary that focuses on the energy crisis and how much impact it has on the economy. With interviews from Colin Campbell and Chris Skrebowski, this gives us an insight on the nature of the financial crisis. The financial consequences are so overwhelming that this subject should be at the heart of political debate everywhere.

http://www.naturalregressionfilm.com/

Major Change Down Below... Live Blogging...

The Gulf of Mexico disaster at the Deepwater Horizon blowout is morphing into something even worse...MUCH worse...The seafloor appears to be bucking, and the pipe may have failed...There are 50 million barrels of oil under this well, and it's all trying to get out. BP is worse than incompetent...

They should all be hung...and the Government,as usual, is clueless...

Here's the link:

http://monkeyfister.blogspot.com/2010/05/major-change-down-below.html

What is just now dawning on me, and not dawning on too many other people, is that Gulf Coast seafood, was an inexpensive source of protein along the Southern States and for much of the rest of the U.S. as well. What will replace this huge protein source? Chicken? Beef? How much fossil fuel does it take to produce these replcement protein sources from feed? Quite a bit, and the very existence of deep water oil wells is a signpost of peak oil. Guess what, welcome to the age of food scarcity and sky high prices...

Saturday, May 22, 2010

Schama: Are the Guillotines Being Sharpened?

http://www.nakedcapitalism.com/2010/05/schama-are-the-guillotines-being-sharpened.html

Probably.

Experimental moving averages


These moving averages are 'dynamic' reflecting the stretching of time. Here is the $SPX from mid '06 to the present. The effects of the recent 'flash crash' are evident, and suggests a market turning down. In spite of the capitulation day we seem to have had, the rally we are starting now will probably be rather short in duration, and this chart strongly suggests the Bear is back...

The only question is, of course, the coming rally's duration. The two possibilities seem to be that the rally stops quickly at the current downtrend line, which would be very short indeed. The other possibility is that we see some kind of double top scenario with the April high. We'll have to watch the indicators closely to see which happens...

Friday, May 21, 2010

Some caution here...

Don't get too short term bullish even though sentiment is extreme..the futures are still pointing down...When a rally does materialize it should be used to reposition for more downside, but be patient...

Thursday, May 20, 2010

Today the 20th of May, was a capitulation day.

These are the most extreme bullish readings I've ever seen on this indicator!

Use the coming rally to position yourself for the next big downleg...

Another reason to expect a bounce...


The SPY opened and closed below it's Bollinger Bands...usually it will make it's way back above them, unless the market is going to completely crash here...

$SPX down channel updated....


I don't know for sure if the lower channel support line is real, but the upper resistance line is a properly computed value and has been honored by the market (so far). If today was some kind of capitulation, I would expect the price action to wander back up to that upper dashed line, which as you can see is today at about 1150...This is where one could re-short the $SPX...of course by the time ( a few days from now) the market gets up that high, that line will be slightly lower than 1150...I will update as necessary to show where that point is...

(click to enlarge)

Capitulation?


Wednesday, May 19, 2010

probably double bottom completing ...

The Bear may go back into hibernation just a little while longer...The bigger picture may be another top in a couple of weeks to form a double top...

Watch out for tomorrow....


The bear attack could be over as soon as tomorrow. These are short term trendlines that seem to be converging towards a bottom. If this plays out, then the scenario put out by Nadeem Walayat would seem to be the right one, and that could play out tomorrow. The two light orange circles are the target zones...either could be valid, though I favor the top one slightly...

Tuesday, May 18, 2010

This is a scenerio that could easily play out...


http://www.marketoracle.co.uk/Article19546.html


by Nadeem Walayat

I would agree with Nadeem's analysis as a possibility, watch the readings over at Sentimentrader.com, if sentiment hits a bearish extreme as the Markets get near the lows of last February, exit all bearish positions, and wait for the end of the 'C' wave to renter them...Although I can see a potential exponential channel forming (previous post) it is quite tentative and can be overruled if sentiment gets excessively bearish too soon...then the scenario Nadeem provides becomes more probable...

Possible exponential down channel identified in $SPX

It's not absolutely a sure thing yet, but compliance at the tops is clearly good, if we get a nice local bottom that sits on the same trendline as the last decline, shown in the middle of the graph above, then the channel is established...

Meredith Whitney Sees Bleak Second Half in Stock Market, Small Business Credit Crunch, Double Dip in Housing, Says European Banks in Worse Shape


http://globaleconomicanalysis.blogspot.com/2010/05/meredith-whitney-sees-bleak-second-half.html?utm_source=feedburner&utm_medium=feed&utm_campaign=Feed%3A+MishsGlobalEconomicTrendAnalysis+%28Mish%27s+Global+Economic+Trend+Analysis%29


I agree with this....

U.S. market curbs will start as early as mid-June

http://www.reuters.com/article/idUSTRE64H3SV20100518

Like that will change anything, right?

Monday, May 17, 2010

Market continues it's decline


Fibonacci calculations would put the end of the first decline (an A-B-C affair) down around 1020 or so, just below the red, highlighted trendline....then a serious bounce, and then more declines after that...

Something happened - James Howard Kunstler

http://kunstler.com/blog/2010/05/something-happened.html

Excerpt:

Something snapped in the world last week and a lot of people around the world sensed it -- especially in the organs of news and opinion -- but this ominous twang was not very clearly identified. It was, in fact, the sound of the financial becoming political. The macro-swindle of a worldwide Ponzi orgy now stands revealed and the vacuum left in its place is about to suck everything familiar into it -- standards-of-living, hopes, dreams, not to mention lives.

Friday, May 14, 2010

Microtrendlines


Market rolls over...


and the Big Picture:

Doug Casey on the Military

http://www.caseyresearch.com/displayCwc.php?id=30

Interesting commentary...

Hopper's Oscillators...

Hopper provided this diagram showing his relative price and money flow oscillators. Here is his commentary:

Hi Mark,

Attached is a picture of 2 oscillators for the SPX, the darker line is a relative price oscillator, the orange line is a money flow oscillator.
The data is current to May 12th closing. One can see the darker oscillator broke higher and met resistance as today's market shown.
The orange is still under water.
Until the price oscillator changes its resistance levels, it doesn't look bullish to me.

Cheers,
Hopper

Wednesday, May 12, 2010

Today's short term charts...


The bottom one looks almost perfectly like my prediction from yesterday...The top one shows additional trendlines..If the market greatly exceeds these lines in the next couple of trading days, then something else is going on...(High frequency trading, perhaps?)

Tuesday, May 11, 2010

Rally running into trendlines tomorrow...


Projected into tomorrow, some very short duration trendlines generated from last Thursday's crash will be encountered, so if the rally is to end (and I think it will) we should be about through it now...

As such, it looks like this rally is probably a 'B' wave, and the coming 'C' wave should be roughly equal to the 'A' wave, by Fibonacci methods. That would put the S&P down to around 1016 or so, which would put it just below the next support exponential trendline. Looks about right...

Yelnick - We Have Begun the Endgame of Greenspan's Experiment With History

http://yelnick.typepad.com/yelnick/2010/05/we-have-begun-the-endgame-of-greenspans-experiemt-with-history.html#tp

Interesting market discussion....

The Gulf appears to be bleeding

http://peakoil.com/enviroment/the-gulf-appears-to-be-bleeding/

Amazing picture...

Monday, May 10, 2010

Today's bounce.


It's unusual for a real rally to begin without touching and slightly exceeding (on the downside) support trendlines. This would make me think today's pop could be a fakeout and another decline should start to 'get the job done' of hitting support. We'll just have to wait and see what happens next..

Saturday, May 8, 2010

$Microtrendlines - $NDX and $SPX


The $SPX chart in particular, looks like it wants to reach down to the thick red trendline for support...

Microtrendlines - $RUT


I would suspect this market will decline until the obvious support here is touched and then slightly breached...I doubt the resulting bounce will be another bull run...

A hint from Max Keiser - "Congress - Shorting America?"

http://www.ritholtz.com/blog/2010/05/why-does-congress-hate-america/

Can you say T r e a s o n . . .

Friday, May 7, 2010

Another downleg in progress...

My reading of the charts says we have another segment down which would be a wave '5'...the recovery from yesterdays plunge was wave '4', I believe...The next down leg could complete late today or Monday...We should go below yesterday's low before a real relief rally starts...

Thursday, May 6, 2010

Microtrendlines - post crash..


Probably a lot more downside to come...

Today's crash...


Remember this chart from about a month ago? Look at it now!
Also, are we now forming the right shoulder of a large head and shoulders pattern (it looks that way above, right?), or is it back to declines tomorrow?

(Click to enlarge)

Wednesday, May 5, 2010

Microtrendlines - $SPX


I think you can all see another moment of truth coming up here...Will this market break the through the support trendline that has held it on both previous declines? That trendline is currently around 1137 or so and rising at about 7/10th of a point per trading day......

William Engdahl: Financial Warfare Against the Eurozone

http://maxkeiser.com/2010/05/05/william-engdahl-financial-warfare-against-the-eurozone/?utm_source=feedburner&utm_medium=feed&utm_campaign=Feed%3A+Maxkeisercom+%28maxkeiser.com%29

Monday, May 3, 2010

Catherine Austin Fitts - The Big Alienation


http://solari.com/blog/?p=7158


Excerpt:

It is not that no one’s in control. Washington is full of people who insist they’re in control and who go to great lengths to display their power. It’s that no one takes responsibility and authority. Washington daily delivers to the people two stark and utterly conflicting messages: “We control everything” and “You’re on your own.”

Sunday, May 2, 2010

Fears for crops as shock figures from America show scale of bee catastrophe

http://www.guardian.co.uk/environment/2010/may/02/food-fear-mystery-beehives-collapse

As we lose control of the oil supply, by bits and pieces, our past use of petroleum based chemicals is having an ominous effect on our food system through death of the pollinators...

Michael Ruppert: Gulf Oil Leak Catastrophic

http://peakoil.com/?p=54002

BP is possibly not being truthful about the magnitude of the leak..

The end of something? or the beginning of something we hoped we'd never see....