Wednesday, June 30, 2010

Russell 2000 end of day charts


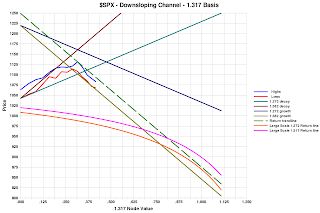
Same color scheme protocols as the $SPX charts in the previous post...Notice that the $RUT has been a little better behaved relative to the lower side of it's channel then the $SPX (see earlier post) which has briefly broken down below it's channel and has been trying to climb back into it....The Russell 2000 channel is also a little wider then it's $SPX counterpart....

$SPX end of the day charts...


Notice that I have made the color coding more consistent...The magenta (purple if you prefer) and orange solid trendlines in the bottom chart, are the same trendlines of those colors in the top two charts, although up there, they're dashed instead of solid...

The $SPX almost made it back up into it's small downsloping channel today with a bit of a tiny rally, or bounce, but that didn't quite hold throughout the afternoon...

Class War and the Decline of the West

from Le Café Américain

http://jessescrossroadscafe.blogspot.com/2010/06/class-war-and-decline-of-west.html

Excerpt:

I receive at least ten emails per day from the self-enslaving, sadly to say mostly older men like myself, that repeat the slogans and urban myths like faithful party members, seasoned with hateful prejudice and mindless propaganda, so I know that the influence peddlers and indoctrinators are doing a good job of it, subverting the middle class.

It is a little remembered fact that the greatest boost in support for the rise of the National Socialist party came not from the underclasses which was always a minority, but from the more influential professional class, the petit-bourgeois: doctors, dentists, accountants, shop owners, and small business owners. They added their force to the earliest supporters , the industrialists and the monied interests, the bankers and the industrialists.

Reflexivity and Fraud: Manipulating Polls, Prices, Perceptions, and Outcomes

http://maxkeiser.com/2010/06/30/reflexivity-and-fraud-manipulating-polls-prices-perceptions-and-outcomes/?utm_source=feedburner&utm_medium=feed&utm_campaign=Feed%3A+Maxkeisercom+%28maxkeiser.com%29

A nice, short, and to the point editorial over at Max Keiser's website...


And by the way, the $SPX is clawing it's way back into it's channel this morning...good boy....

Tuesday, June 29, 2010

Another view of the Markets, the bigger channels only...

With today's data:


Chart that Hopper found...

Hi Mark,

Attached is the graph I posted in the comments section. I found it from "Gold vs Paper" Blog.

Probably a bounce here...

We've just seen real low readings on RSI for the Indexes. For the $SPX 15 minute chart, RSI reached 15.892, and for the 5 minute chart the value is 10.304. Since we have slightly exceeded the down channel and reached the level of previous bottoms in the 1040 area, common sense says we bounce a bit here...But the decline has a long way to go, a couple of weeks at minimum...

For completeness sake, here are the RSI readings for other indexes:

$RUT, 15 minute - 18.348, 5 minute - 11.883
$NDX, 15 minute - 13.335. 5 minute - 12.049

For the Ultimate Oscillator:

$SPX, 15 minute - 25.877, 5 minute - 15.207
$NDX, 15 minute - 25.465, 5 minute - 17.483
$RUT, 15 minute - 22.077, 5 minute - 10.843

$SPX and $RUT with this morning's data...

Charts updated End of Day, 3:00 CST...


It continues to look as though the $RUT could bottom earlier than the $SPX by as much as a week, but that's just an eyeball estimate from these charts, and it could still happen on the same day, as there is overlap between the two charts. In any event that moment is a ways off yet, so no worries...

Update, Comment: The $SPX has dropped below it's small decline channel, we'll see if it recovers tomorrow. If the decline is accelerating, then the date for the near term bottom may move up, the timing obviously depends on integrity of the smaller channel...

Monday, June 28, 2010

$SPX down channel for Monday, 6/28/2010...

After a volatile session, the $SPX managed to hit the top of its channel and then it backed off. The $RUT actually exceeded it's channel slightly, then it also backed off. Tomorrow will be an important test of the channels and everything else...

Clickcharts defines a potential crucial point...

The blue lines align with moments that preceded significant market declines. The orange lines are just picking points along an indicator which is produced by the products of moving averages similar to MACD. You can see I picked the points where both indicator(s) went negative. Clearly the Clickcharts indicator (the top one) which is volume weighted, has an edge...

Does the Clickchart method always work? No, but it has worked pretty well lately...

Saturday, June 26, 2010

Conventional Technical analysis by Brian Bloom...

http://www.marketoracle.co.uk/Article20598.html


Well argued, if nothing else...and it's current...

Down channels in the $RUT and $SPX...


The $RUT filled it's channel and then backed off, the $SPX never reached the top of it's channel. What's shown are high's and low's for each day...

Friday, June 25, 2010

A brave and furious Louisiana women tells the truth.


This women tells it like it is. BP runs the Gulf Coast, and the U.S. Government is their slave, the people of Louisiana are expendable and no one cares if the people who live there (in lower Louisiana) all slowly die.

Further, BP is faking much of the rescue and recovery operation, and making it a bureaucratic nightmare to get a respirator if you volunteer to work on the cleanup. People already stricken by chemical poisoning have been explained away as 'heat exhaustion' and 'food poisoning'. Ridiculous.

This women, named Kindra, is watching her own children suffering from rashes and respiratory problems that magically go away when they get even a day's respite away from their home on the Gulf Coast.


Don't think you can ignore this. The evil these coastal people are suffering through, will, sooner or later, be the evil we all experience.

This is global.

Her story is the warning about your future. Her story is here:

http://www.youtube.com/watch?v=h3bzypjTIWg&feature=email

Realize, that the world is being taken down....ecocide, and ultimately genocide are what the 'powers that be' will eventually bring us....


The photo of the oil soaked wave is from near Orange Beach, Alabama. You can find this image spreading around the internet almost as fast as the oil is spreading across the Gulf of Mexico.

The original link is here:

http://www.businessinsider.com/oil-spotted-waves-alabama-2010-6

Monbiot On Dark Mountain - our place in the future world...

http://peakenergy.blogspot.com/2010/06/monbiot-on-dark-mountain.html

Excerpt:

Today's greens, it charges, seek to sustain the culture that knackers the planet, demanding only that we replace old, polluting technologies with new ones – wind farms, solar arrays, wave machines – that wreck even more of the world's wild places. They have lost their feelings for nature, reducing the problem to an engineering challenge. They've forgotten that they are supposed to be defending the biosphere: instead they are trying to save industrial civilisation.

That task, Paul Kingsnorth – a co-founder of Dark Mountain – believes, is futile: "The civilisation we are a part of is hitting the buffers at full speed, and it is too late to stop it." Nor can we bargain with it, as "the economic system we rely upon cannot be tamed without collapsing, for it relies upon … growth in order to function". Instead of trying to reduce the impacts of our civilisation, we should "start thinking about how we are going to live through its fall, and what we can learn from its collapse … Our task is to negotiate the coming descent as best we can, whilst creating new myths which put humanity in its proper place".

Thursday, June 24, 2010

Effects of Oil Spill already on Lousiana crops?

http://www.youtube.com/watch?v=TXlC7gvvJZw

No proof yet, but it's highly suspect...

Watching the video of strangely spotted and dying crops, weeds, and trees, it's creepy...

Hopper's take on the current market...


Hi Mark,

On the attached picture shows the SPX reaching its lower support. This would infer that (for the short term) maybe a bit more down but not much more...?


My take is that this down move has a lot further to go (although a short term oversold bounce is certainly possible), but I respect a fellow traders caution....

Risk control is what it's all about so I support anyone bailing out when their tools and methods tell them it's prudent to do so...

And I don't claim to know all of the answers, so other input is always welcome. I can always be wrong....

Mark

A statement from Paul Craig Roberts

One of my friends from near Tulsa sends me emails with this closing script, which is totally true as far as I can tell. I post it here:

Paul Craig Roberts writes,
"Today Americans are ruled by propaganda.
Americans have little regard for truth, little
access to it, and little ability to recognize it.
Truth is an unwelcome entity. It is disturbing.
It is off limits. Those who speak it run the risk
of being branded 'anti-American,' 'anti-semite'
or 'conspiracy theorist.' "

An interesting letter over at George Ure's 'Urban Survival' Site.

http://urbansurvival.com/week.htm

Reader writes to George Ure...

Here's a good one:

Hello, George- Do enjoy reading your website. Found it interesting that some people are wondering IF this nation has stepped upon the slippery slope of totalitarianism. Must truly be asleep at the wheel, if anyone actually needs to ask this question they are most definitely in need of removing their blinders. What is more important is WHY would this nation be rushing into the arms of totalitarianism.

The short answer is that our nation has actually invented a new sect of fascism for itself. This sect is somewhat different from previous fascist states in that it finds it useful to pander to the traditions of a dead republic, yet as a fascist enterprise, it cannot help but gobble up every impediment to absolute power. The long answer is that our ruling oilogarchy long ago chose war to fuel the economy, directly and indirectly.

The racket of war has been praised by every president since Jackson, and war in the dead republic is all about the enrichment of well connected corporate "contractors". The oilogarchy chose war to control the social order. It chose war to enrich u.s. corporations at the expense of invaded and decimated lands. Only one little problem with the total war mentality of the dead republic, despite all the hubris, the dead republic cannot win any more wars. In fact, similar to most military first, aggressive fascist states, the way to the fall is through military defeat.

Thus, the Iraq debacle, where the occupational forces must hold up in their fort to be safe. Thus Afghanistan, where indigenous, poorly armed and trained warriors are defeating the shining army, one day at a time. The greatest ruse of the dead republic is the false claim of rule by the people, for the people. In our fascist state, it is the corporation which stands supreme, and government which is the corporate boy.

Obama does not dare remove BP from their leadership role in murdering our oceans, he must be a good little messenger for the giant multinationals, and look, indeed he is. The chapter we are facing now certainly appears to be summarized by the old proverb-what comes around goes around.

Going now on 200 years of devastating nations and taking their wealth, is it any real surprise that the PTB would finally focus their jaded eye on the nation that hosted the slaughter? Of course it is inevitable that the cannibals who are slaughtering our nation must lean toward totalitarianism. The propaganda network can only hold the masses in check for so long once the beer, food, and shelter disappears into the pockets of the fascists.

Well, we've seen the war on Communism, the war on poverty, the war on drugs, and the war on terror-which by the way is absurd-Terror is a tactic, not a person, place, or thing. It is a functional impossibility to wage war on a tactic. Perhaps the latest unleashed by our fascist elite should be called the war on U.S.

Kind of echoes my own sentiments, almost exactly...

$SPX and $RUT downsloping channels.


These are somewhat preliminary, but with this morning's data already plotted the new channels look O.K. The targets are the magenta and orange down-curving lines, which are a little earlier on the $RUT then on the $SPX. I can't explain the discrepancy, but to hedge a bit, the bottom is somewhere from mid to very late July. July 21st is near the center of the time span in question, and would satisfy both charts, but that's not a firm prediction. We'll just have to wait until we get close to there and see on what day the light magenta trendlines are assaulted on both charts. That will be the bottom.

By the way, these channels are generated by the 4/26/10 top, the 'flash crash' low and the and the low on 6/8/10...

Wednesday, June 23, 2010

How long to stay short?

O.K., this is just preliminary, don't hold me to it, but IF I have the new channel defined correctly, we might have a significant (playable) bounce at the very end of July...but this is still fluid, I can change my mind tomorrow as the data is not all in yet...

Clean the Gulf, Clean House, Clean Their Clock by Frank Rich

http://www.nytimes.com/2010/06/20/opinion/20rich.html

Excerpt:

While the greatest environmental disaster in our history is a trying juncture for Obama, it also provides him with a nearly unparalleled opening to make his and government’s case. The spill’s sole positive benefit has been to unambiguously expose the hard right, for all its populist pandering to the Tea Partiers, as a stalking horse for its most rapacious corporate patrons. If this president can speak lucidly of race to America, he can certainly explain how the antigovernment crusaders are often the paid toadies of bad actors like BP. Such big corporations are only too glad to replace big government with governance of their own, by their own, and for their own profit — while the “small people” are left to eat cake at their tea parties.

When Joe Barton, the ranking Republican on the House Energy and Commerce Committee, revived Rand Paul’s defense of BP last week by apologizing on camera to Hayward for the “tragedy” of the White House’s “$20 billion shakedown,” the G.O.P. establishment had to shut him down because he was revealing the party’s true loyalties, not because it disagreed with him. Barton was merely echoing Michele Bachmann, who labeled the $20 billion for gulf victims a “redistribution-of-wealth fund,” and the 100-plus other House members whose Republican Study Committee had labeled the $20 billion a “Chicago-style shakedown” only a day before Barton did.


These tribunes of the antigovernment right and their Tea Party auxiliaries are clamoring for a new revolution to “take back America” — after which, we now can see, they would hand over America to the likes of BP. Let Deepwater Horizon be ground zero for a 9/11 showdown over the role of government. There couldn’t be a riper moment for Obama, as a man once said, to bring it on.


Tuesday, June 22, 2010

Russell 2000 sell signal.


After the first day down after the 'top' my Log-Ex moving average system is also issuing a SELL signal...

Ghost caught on tape! Really!

This is one of those, you gotta see it video...It was picked up on a night security camera...at a Habitat for Humanity retail outlet.

http://www.wlos.com/shared/newsroom/top_stories/videos/wlos_vid_2437.shtml

Really a fairly clear image, it even set off a burglar alarm!

Put up with the short commercial before it starts...

CNN - Oil crisis turns U.S. politics upside down

http://edition.cnn.com/2010/OPINION/06/22/avlon.oil.politics/index.html

It will take even more devastation for real change though...it's sad.

Today's end of day charts...


Needless to say, we're out of the rally channel now, and shorting is without anxiety at this point...


By the way, here the overall trendline chart for the Russell 2000, same thing:


Rolling over....

Monday, June 21, 2010

How well did my predictions from last Monday work out?

Well, my first attempt to model a bear market rally wasn't too bad...

Here's the set of three models as a screenshot from last Monday evening:

In that post, I ruled out the last model as having already passed by inconclusively, and placed my bets on the middle model...Assuming today was the top, it came in at 1131.23 on 6/21, which means the first model was the closest to what actually happened...

If you want to add more short positions wait for the 'bounce' to pass....


Although I don't normally try to do intra-day predictions, the end of day chart of the $SPX rally channel we've been following makes it obvious that a pretty good bounce is coming. Let it pass before adding shorts...

Larry Edelson with an interesting market roadmap...

http://www.uncommonwisdomdaily.com/must-watch-market-signals-9613?FIELD9=2

Some interesting cycles work here..we'll see how well he does, he could be right...

We had our little 'pop' this morning..looks like it turned into a nice reversal....

Especially on the $NDX...but all indexes are sporting what are arguably, reversal patterns...

A Hole in the World - Naomi Klein

http://www.opednews.com/articles/1/Gulf-oil-spill-A-hole-in-by-Naomi-Klein-100619-113.html

Hubris personified.....

Pretty good pop, a little surprising..


In one swoop, market action passed through the 1.272 trendline (dark magenta in the top chart) and almost touched the last line in the sand, the 1.317 trendline (orange in the top chart).

Both trendlines can also be seen in the bottom chart, both are orange, and close together, with price action on the top one, but not through it...

Again, the top chart can be seen as a 'blow up' of the last part of the bottom chart, with the rally channel added in, as dashed lines...

The high of 1131.23 reached this morning was 1.01% above the 1.272 trendline and .13% below the more extreme 1.317 trendline. Most of the time, price action has to exceed a major trendline by 1% or so for a reversal to happen anyway...

Sunday, June 20, 2010

Interesting chart by Hopper...


He's getting a similar result, that the top is in or close...

His comments:

I added upper and lower limits to show the oscillator channel (hit the bottom blue and buy, hit the top red and sell (or short)). Also one can see the channel moving as well. Appling EW, we could be hitting "B" (if A-B-C decline).

Very interesting work...

Renaissance 2.0

http://www.youtube.com/watch?v=Zw3i5Rzpx5A

The Vortex...

Some more rally detail...


Look at the annotations on the upper chart first...Click on each one to enlarge...

Just for info, '3>1' refers to trendlines generated from the rally top on 1/19/10 and '5>1' refers to the 4/26/10 rally top, both large scale events from the 2009-2010 rally. They are from Elliott notation, counting waves...you know, wave 3, wave 5....

I'm not sure why it happened, but the slight, residual positive bias in the market after the rally channel stalled mid-week seems related to that violet 3>1 trendline in the lower chart. First it was a nominal resistance, that didn't do much, and lately, it has become support, and the highs of recent days have paralleled it in a sloppy fashion....

The next act in the show, is the big trendline coming down from above, which is now almost in contact with the price action...

Saturday, June 19, 2010

Mike Larson - The snowball effect

http://www.moneyandmarkets.com/the-%e2%80%9csnowball%e2%80%9d-scenario-sinks-sovereigns-39440

Inevitable. Everywhere.

Max and Stacy do a fascinating presentation

If you want to see the future you have to understand the past and present. I know of very few in the league of these two for helping us do this...

http://ia360702.us.archive.org/11/items/MaxKeiserRadio-TheTruthAboutMarketsUsa-Pilot3-19June2010/tamusa-190610.mp3

Remember to suspend your natural tendency to think like a pre-programmed serf before you listen to these two. They present unconventional truth best grasped by free thinkers who call a spade a spade. No left or right wing spin, No political correctness, No that can't be or can't be happening here, No ideological BS permitted....Just raw, blunt, clever and unusual insight into the web of corruption and pathology that is enveloping the social fabric, ecosystem, and financial markets...

The higher you fly (intellectually) the smaller you appear to those who can't fly....Frederick Nietzsche

Friday, June 18, 2010

$SPX trendlines (not all of them as in the last post from yesterday) just the ones we're directly involved with...


Plus the lower 'return' trendline, used to construct the 'channel', which is derived from the top trendline, and unlike that top trendline it is not the result of a primary computation...

Notice also the way the rally channel from the 6/8 bottom now looks:


Here it is the bottom trendline that is primary and the top one is derived from it by adding a price displacement, same procedure but different ordering of primary and derived, as the top chart in this post.

What's interesting on the rally channel chart is that the price action is no longer climbing right up it so much as it's sliding across the top of it, albeit with a slight upward bias. I think that bias ends as the 1.272 model's major trendline (as shown in the top chart),lowers over it... Over the last two trading days the $SPX has only advanced less than 3 $SPX points, from 1118.74 to 1121.01, whereas in the first few days of the advance, 5 to 10 points in a day was normal... Basically, the market is following my 1.272 model from the presentation here on this blog last Monday night of three models. The only difference between my modeling and reality is that slight upward bias that I didn't anticipate happening for the moment when the rally channel stalled near the price target, and price action started moving across the channel....
----------------------------------------------------------------------------------------------------------------------------------------
For anyone that didn't read the two posts about 'modeling the rally', that this post is referring to and built on, there is a lot of info in there, and new concepts, so here they are for those that want to review them:

http://marketmathematics.blogspot.com/2010/06/modeling-rally.html


http://marketmathematics.blogspot.com/2010/06/modeling-rally-part-2.html

Thursday, June 17, 2010

All $SPX trendlines at close today

Tomorrow the bright overhead orange trendline is at 1122.17 and the daily Bollinger Bands look to be at about 1123. Hourly bands are at about 1120...Being that they're all pretty close, they should reinforce each other...The narrowing of the hourly Bollinger Bands on the lower chart implies that some significant move is afoot...as does the Fast Volatility measure at the bottom of that chart.


Wednesday, June 16, 2010

A couple of market and trading thoughts...

Now having seen that the market ended up as a ascending wedge, I see why I couldn't get a good entry point for a bullish run. Ascending wedges are a sign of a weak market. Had there been a typical A-B-C pattern in the up move from 6/8/10, there would have been more visits to the lower channel line, I believe...

By all rights, the market should be done with the rally, and with a couple days confirmation, it should be time to really go short....

$SPX channel as of today...


At 1118.74, the $SPX has completed it's price objective for the day, according to the upper channel trendline...Also, it is conforming exactly to the 'unadjusted' 1.272 model I wrote about Monday night....

I suspect now, we have either seen the top today, or it will be tomorrow...But we need corroboration...

One concern I have, is I haven't seen the expected A-B-C pattern, and the price action has only visited the bottom of the channel once and very early on, so there is a chance this market could fake out the Bears by declining here, going to the bottom of the channel and bouncing back for a 'C' wave. Just a thought...

In any event, something is about to happen, notice the terminal wedge:


Update: I took out a small short position just before the close...

Rally now close to the end?

From the sentimenttrader site last night:
And this is the latest 1.272 model :


One warning though, these exponential trendlines like to be reached and exceeded slightly, so don't be surprised if the market gets one last burst of energy and runs a little higher before it fails...

Tuesday, June 15, 2010

Bird brains!

http://www.youtube.com/watch?v=ZPyo_MxRfeo

http://www.youtube.com/watch?v=0bt9xBuGWgw

The Very Angry Tea Party

http://opinionator.blogs.nytimes.com/2010/06/13/the-very-angry-tea-party/?src=me&ref=general

Some truth in this.....

Rally has accelerated...

The daily Bollinger Bands on the $SPX are at about 1131 right now, at this rate they'll be hit tomorrow...1.272 exponential trendlines are at 1126.62 tomorrow, so we have a couple different resistances close together..Could be that a modified 1.272 Scenario is playing out...we'll see...

By the way 1.5% beyond 1126.62, is 1143.52, so this still could end up topping towards the end of the week...

No One Likes To Talk About This (predicted major war) - Larry Edelson

http://www.howestreet.com/articles/index.php?article_id=13722

Although I had to copy and blow up a couple of his charts to see them better, this is worth a read, talks about the high probability of a major war between 2014 and 2017...

For lots of reasons this also makes sense to me..2012 is the year that peak oil really hits big, based on the well predicted crossing of the supply and demand curves, and 2014 is the year that an agreement that gives us almost free nuclear fuel for our reactors from Russian decommissioned warheads comes to an end. So the west in general, and the U.S. in particular, will have a real energy crisis on it's hands and with a desperate population...

$SPX pushing past 1.382 model...


Breaking higher...

See yesterday's posts for explanations...

Geothermal Elbowing its Way into the Mainstream


http://www.safehaven.com/article/17155/geothermal-elbowing-its-way-into-the-mainstream


This a good thing...like Nuclear without the waste....

BP’s Rating Cut by Fitch to Two Levels Above ‘Junk’

http://www.bloomberg.com/apps/news?pid=20601087&sid=akLiysG_VLJQ

As it should be....

Monday, June 14, 2010

Modeling the rally, part 2

The Three Possibilities:


Here you see the small rally channel mapped out in the previous post, and extended to where they intersect the main trendline(s) generated from the entire previous rally (March 2009 Bottom to the April 2010 Top). The arrows point to the point in time and price where the upper channel line shown in the previous post intersects these bigger scale trendlines...

Since major exponential trendlines are often exceeded by about 1 to 1.5 % before they cause a reversal, multiplying the figure shown on the charts above by 1.015 and then matching the new 'updated' prices based on the charts above to the calculated results of the upper channel shown in the last post, that finally gives these slightly revised price points and dates:

Slightly revised three possibilities (models) based on the above exponential chart price trendline intersections increased by 1.5%:

1.272 Basis, 6/18 or 6/21 at 1135.18

1.317 Basis, 6/22 or 6/23 at 1148.37

1.382 Basis, 6/14 at 1108.6

It would be easy to argue that the last one has already happened (today) and is a good match for reality. Todays candlestick looks like an important top, I should just accept it and go short, that would seem reasonable. I think collision with the 1.382 trendline did cause this reversal, but the game's not over yet. Since we're barely at the .200 node value (closer to the .500 node is the normal termination of a directional move), and I suspect this rally from 6/8/10 is, or should be, a typical A-B-C pattern, I believe we saw 'A' end today, then a drop will continue tomorrow which will be wave 'B', and then the 'C' wave will carry up to a target somewhere from the dates 6/18 to 6/23. I favor the longer target both because the 1148.37 price target gives a good right shoulder symmetry to the $SPX and because the trendlines on the middle 1.317 chart above, fits the three latest bottoms in the best way of the three models shown, and goodness of fit is how you try to evaluate your models...

One more point of note, there are 31 trading days from 4/26/10 to 6/8/10. If you extend out in time by a Fibonacci 38.2%, it puts you to the date 6/23/10....

Of course the market can ignore all of this and just tell me to go to hell, and then none of it aligns after today....

Modeling the rally...


Using the top on 4/26/10 and the 'Flash Crash' lows, and then the low of June 8th, I used these dates and prices as a Start-A-C pattern for the $SPX. Then building a spreadsheet with the highs and lows since the 8th, I get the chart above. Now, in fairness, I thought today would be a down day, and so far, it has not been. I saw negative divergence in some indicators and we were near the 'return trendline' shown in the diagram above as a dashed line. Refer to web articles, Google search 'return trendline'. The foundation for the channel I am creating is the brown trendline along the bottom of the chart. It is precomputed from the A-B-C pattern I have mentioned. Some inaccuracy can be assumed because of the short time scales more appropriate to intraday calculations, and I am doing this with daily data, which puts some obvious limits on fidelity. That said, we are only at less than a .200 node value and most moves get closer to .500 before they terminate. I still think we are near a minor top, (I thought that after the close Friday and over the weekend, though) but the real top I still think is several days away...Relative to the early node values we are at, I think there is time for this rally to build a 'right shoulder' to the April 26 top....

P.S. this chart looks way smoother than an intraday chart of the same time frame because I'm using only the highs and lows of those days...

P.P.S. Those of you familiar with the Math I'm using can build the same spreadsheet. The values I used are here:

Friday, June 11, 2010

The Keynesian Endpoint!


http://www.bloomberg.com/apps/news?pid=newsarchive&sid=abM7IKo.INIk


Stimulus as poison...finally realised? or postponed again?

BP: Is Team Obama Pushing for a Full Externalities Precedent? - Naked Capatalism


http://www.nakedcapitalism.com/2010/06/bp-is-team-obama-pushing-for-a-full-externalities-precedent.html


Is Obama growing some 'privies' finally?

Intraday $RUT trendline

Overall, a nice trendline...but you can see where I got stopped out, where it briefly broke...

Radiohead frontman: Music industry on verge of collapse

http://blogs.chron.com/celebritybuzz/2010/06/radiohead_frontman_music_indus.html

Collapsing...Like so many other things....

Senator Coburn: US Liquidity Crisis Coming in 2 Years – Unless…

No unless about it...It will happen, as our Financial leaders (Bernanke, Summers, Geithner et al.) are at best morons, and at worst, thieves. By the way, 'liquidity crisis' is just another name for 'Depression', but we can't say that word yet, can we?

http://www.cnbc.com/id/37615652

Jim Cramer on this link isn't one of my favorites either, just another Goldman boy, but he is right about what's coming...

Thursday, June 10, 2010

For completeness sake, here's the other $SPX charts with trendlines...

RIGHT SHOULDER FORMING?


Not a prediction per se, but since trendlines are usually exceeded slightly before price action fails, 1150-ish is not out of the question, which would give the $SPX a symmetric right shoulder to match the left shoulder roughly in height...

Looking now at both the $SPX and $RUT, I can see that the steeper precomputed trendlines are contained within the less steep precomputed ones (look at the top example both in this post and also the previous one), and the less steep ones constitute true channels that are heretofore not recognized. So after the right shoulders of these indexes have formed, prices will fall again, but initially at least, at a less violent pace....and contained within channels...

In the charts of the steeper trendlines, I forced channels using parallel lines keyed to the flash crash. Using the slower trendlines, the channels look less forced and seem to fit better...just my opinion... Earlier, I used the trendlines that fit well the steeply declining tops, which were computed in the normal way and used as the anchor(s) of the channels, and then created the parallel trendlines to those in order to fit (somewhat forced) along the two bottoms we had at the time. Now, after the last two days, it's now apparent that the three bottoms that have completed on both indexes since the top, are just naturally parallel (without forcing) to the other precomputed trendlines high up that I haven't talked about much or used. I suspect they now will be...